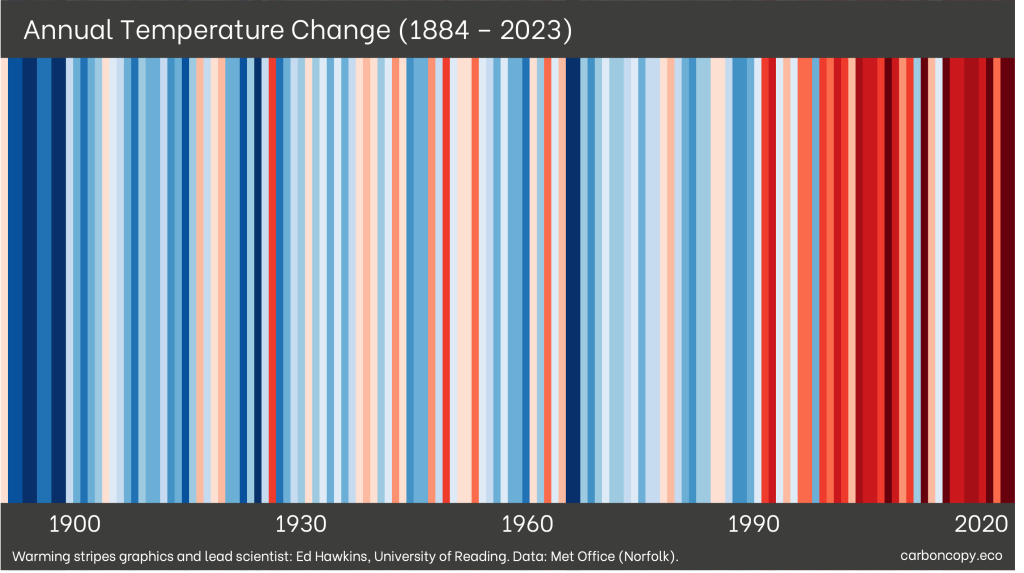
Climate charity Carbon Copy, in partnership with Professor Ed Hawkins at the University of Reading, has just released the latest update to the local climate warming stripes – the iconic blue and red graphic representation of the reality of our heating planet.
First published last year, the local versions of the stripes cover all 379 primary council areas in the UK. Now, with the publication of the 2023 Met Office data on which the stripes are based, Carbon Copy can reveal that for 119 of those areas, last year was the hottest on record.
Carbon Copy’s Chief Storyteller Isabelle Sparrow explains:
“We’ve all heard the news stories recently highlighting that last year, for the first time ever, the global average temperature stayed consistently 1.5 degrees above pre-industrial levels. The trouble is that global figures are hard to relate to, and 1.5 degrees to many people seems insignificant. When we are trying to encourage action to tackle climate breakdown, we need a way of telling a story that is relevant to people right here, right now.

“The local warming stripes show people that this is not an ‘over there’ problem – people are experiencing temperatures like never before in communities across the UK.”
Climate scientist Professor Ed Hawkins added:
“It might seem odd to talk about global heating when we are just coming out of a winter of storms and floods, but all these extreme weather events are interlinked. A warmer atmosphere can hold more water, which in turn creates more rainfall. It’s no coincidence that temperature records and precipitation records are getting broken left, right and centre: it’s all connected, and it all relates to the ongoing release of heat-trapping greenhouse gases from burning fossil fuels.”
One person who has firsthand knowledge of the destruction that more powerful storms can have, is Kevin Jordan. In late 2023, his home of 14 years in Hemsby, on the Norfolk coast, was deemed unsafe and was demolished by the local council.
“When I first moved into my property I loved listening to the gentle sound of the North Sea, but after the Beast from the East in 2018, the storms became more frequent and stronger, and I started to feel afraid when I heard the waves crashing. In November I was visited by a council officer and told I had to leave. I had nowhere to go, no family nearby and little savings, everything I had was tied up in that house.
“I know for a fact that climate change has had a large part to play in my story. Looking at the warming stripes, the change from the blue to the very dark red since the 1800s gives a clear picture of how things are heating up; and with the experience I’ve had, I know the true impact.”
To find out if your area had its hottest ever year last year, visit Carbon Copy, and download your local warming stripes now.